What's Up with Real Estate?

The Case-Shiller index is the most accurate measure of true home price appreciation out there - and it continued to rise, climbing 0.3% month-over-month in April and hitting another new high. That said, price growth is decelerating, and four of the Big 20 cities (Phoenix, Washington D.C., Dallas, and Denver) did post small MoM declines in April. [Source: S&P Global Dow Jones]

Things aren't nearly as competitive as they were in 2021 and 2022 (5 offers per home sold!), but in areas of the country with low inventory levels (Northeast, Midwest), it's still definitely a seller's market. In May 2024, there were 2.8 offers for every home sold nationwide, and 67% of the properties sold were on the market less than a month. [Source: NAR]

Average 30-year mortgage rates have held steady at around 7% for the last few weeks. But with the Fed's preferred inflation measure (PCE) coming out Friday, June 27, that could change. Following a better than expected (that is, lower) CPI figure two weeks ago, the market is hopeful for similar good news from the PCE. [Source: Mortgage News Daily]

| Area | Median Price | Active Listings | New Listings - 5 days | Median Days on Market |
|---|---|---|---|---|
| Palm Springs, CA | $775,000  0% | 763  0.2% | 54 | 49.  -0.2% |
| Rancho Mirage, CA | $975,000 0% | 297 0.1% | 37 | 51 0% |
| Palm Desert, CA | $625,000 -0.1% | 571 0% | 50 | 50 0% |
| Indian Wells, CA | $995,000 -0.2% | 89 0.1% | 3 | 50 0.3% |
/) from May. to Jun. 2024.Statistics provided by:
Stay up to date on the latest real estate trends.
National news and local views for the week ending Friday, June 28, 2024
Coachella Valley May 2024 Real Estate Market Overview
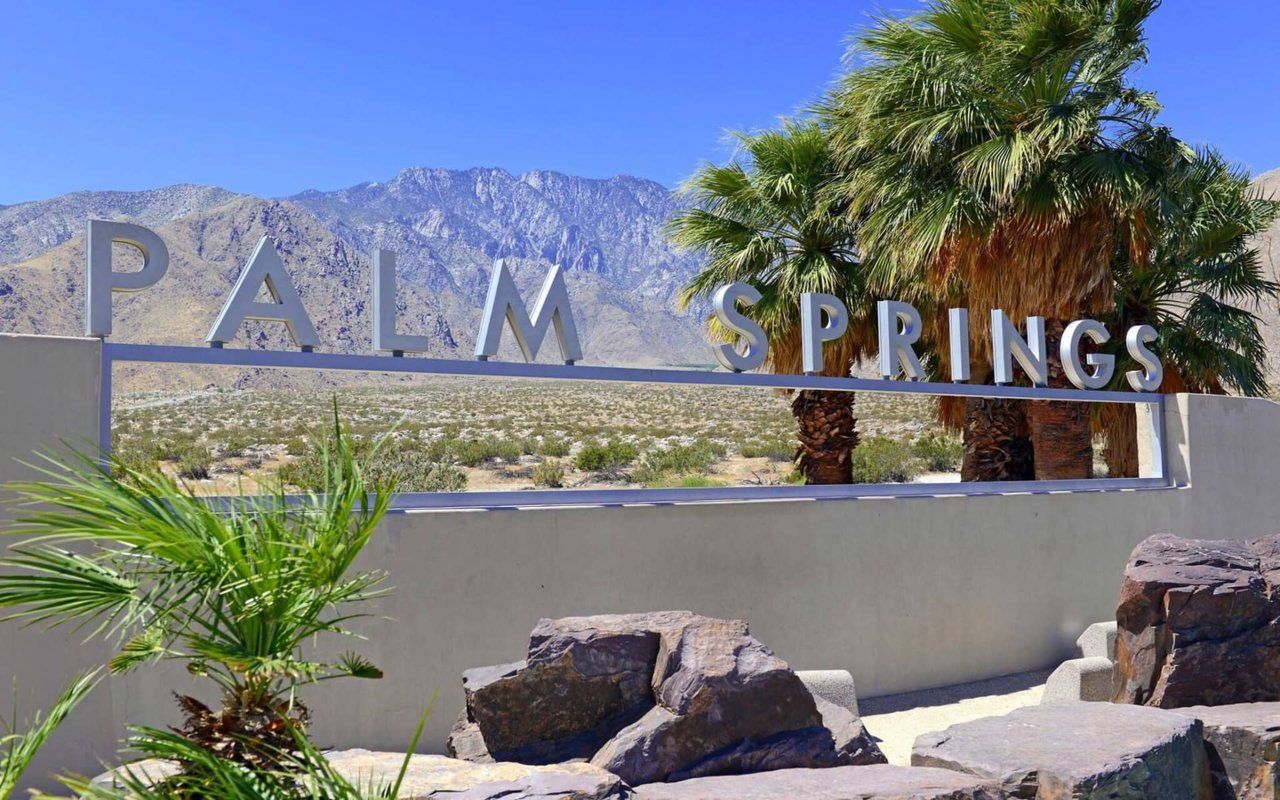
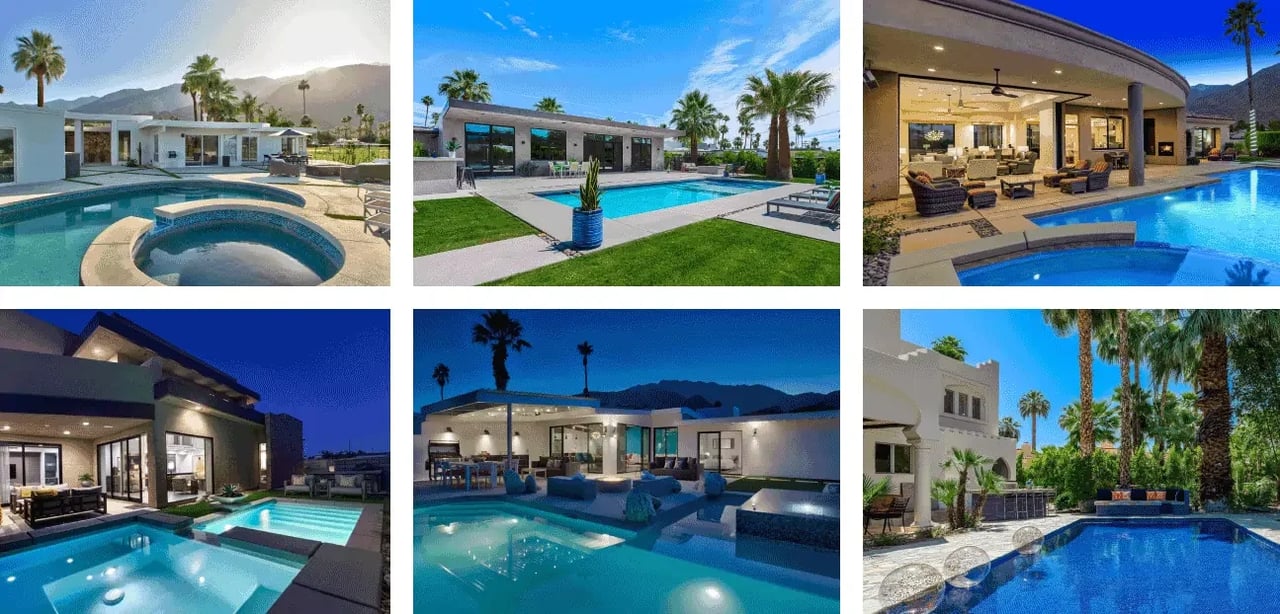
In April 2022, the median listing home price in Palm Springs, CA was $775,000, trending up 38.4% year-over-year. The median listing home price per square foot was $463.
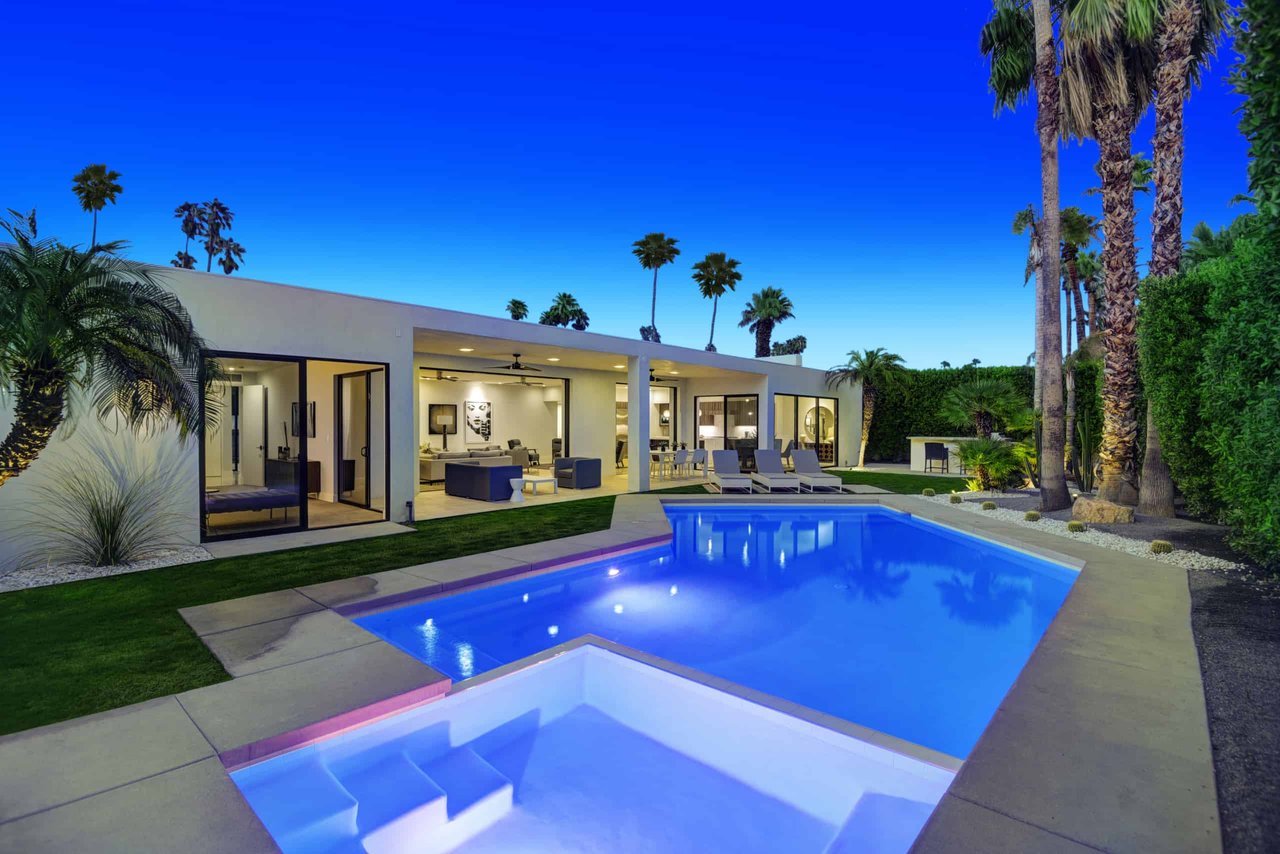
While in most parts of the country, winters are filled with cold air, rain, and snow, the Greater Palm Springs area is just the opposite.Even though our Palm Springs o… Read more
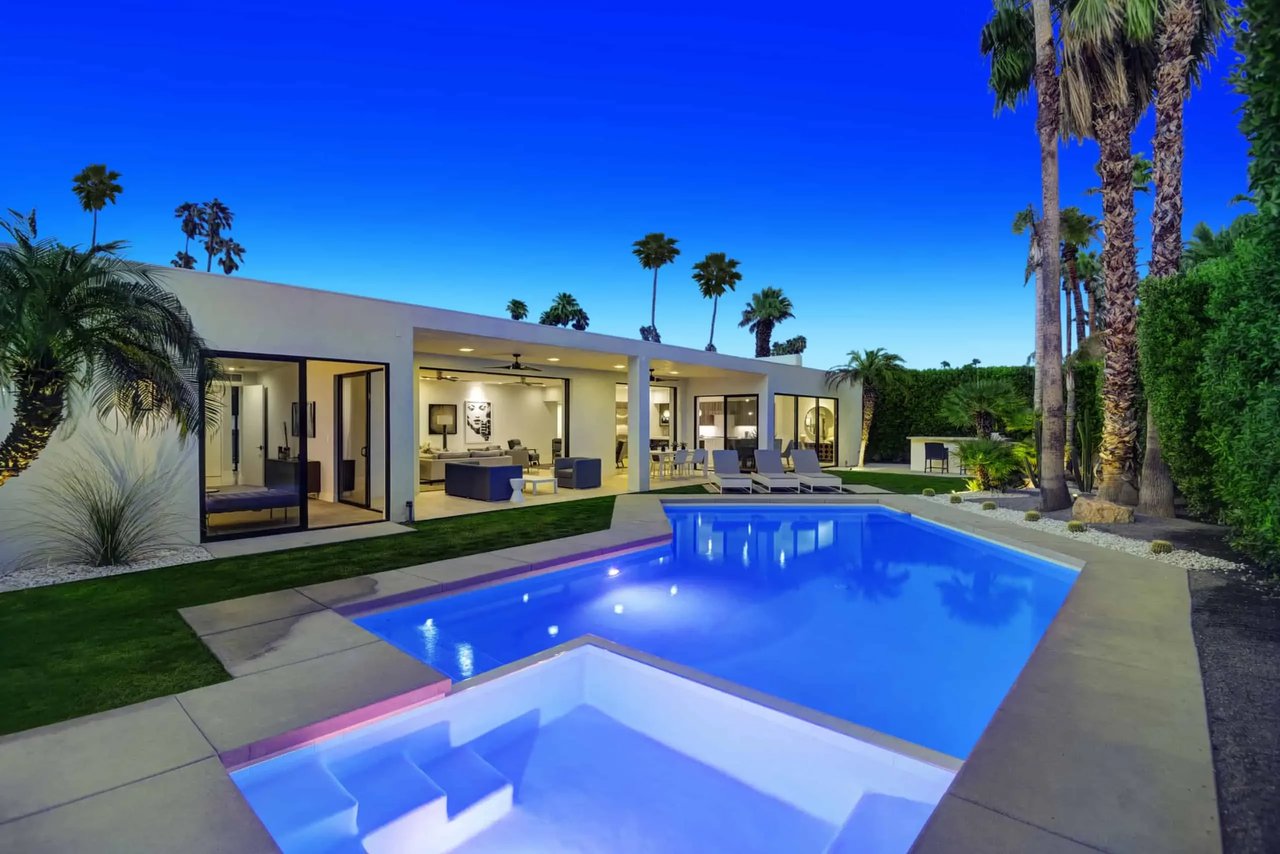
While in most parts of the country, winters are filled with cold air, rain, and snow, the Greater Palm Springs area is just the opposite.
You’ve got questions and we can’t wait to answer them.
